P10 LILLIAD: Connected Learning Center : Différence entre versions
m |
|||
| (11 révisions intermédiaires par un autre utilisateur non affichées) | |||
| Ligne 1 : | Ligne 1 : | ||
| − | + | <include nopre noesc src="/home/pedago/pimasc/include/video-BibliothequeConnectee-iframe.html" /> | |
| − | |||
| − | |||
| − | |||
__TOC__ | __TOC__ | ||
<br style="clear: both;"/> | <br style="clear: both;"/> | ||
| + | The library of University of Lille 1 is in the transformation phase to becoming LILLIAD Learning Center Innovation by 2016. Based on strong service proposal, LILLIAD will offer a unique combination of discovery and experimentation of innovation through an event complex, an experimentarium, educational space and documentary collection. LILLIAD, as desired by University of Lille 1 and the region of Nord-Pas de Calais, will be a place to think, learn and discover about innovation. Situated in the heart of the campus, it will be accessible to companies, innovators, educational institutes and public. | ||
==Scope statement== | ==Scope statement== | ||
===Project overview=== | ===Project overview=== | ||
| Ligne 59 : | Ligne 57 : | ||
To manage the time slots, it’s important to have a database. Thus, I had to come up with a block diagram (of a databse) that describes relationships between each block. | To manage the time slots, it’s important to have a database. Thus, I had to come up with a block diagram (of a databse) that describes relationships between each block. | ||
| − | [[Fichier:Db block diagram.png|750px]] | + | [[Fichier:Db block diagram.png | thumb | 750px | center | Database block diagram]] |
To normalize the diagram, I had to identify the primary and foreign key and use intermediate table such as “configure” and “play_role” as described below: | To normalize the diagram, I had to identify the primary and foreign key and use intermediate table such as “configure” and “play_role” as described below: | ||
| Ligne 78 : | Ligne 76 : | ||
To implement the database, I started with the installation of LAMP stack in Linux. Thus, the packages “apache2, php5, mysql-server php5-mysql” were installed. Then, it was time I configured the MySQL database with the relational database model conceptualized earlier. | To implement the database, I started with the installation of LAMP stack in Linux. Thus, the packages “apache2, php5, mysql-server php5-mysql” were installed. Then, it was time I configured the MySQL database with the relational database model conceptualized earlier. | ||
| − | + | And then, I implemented a website (as shown in figure below) where an admin would be able to upload hexadecimal configuration files and determine the timeslot of the configuration for the boards. The configuration timeslot is limited to 10pm to 6am the following day. | |
| + | [[Fichier:Event.png | thumb | 400px | center |Configuration upload through website]] | ||
===Deploying configuration via network=== | ===Deploying configuration via network=== | ||
| Ligne 86 : | Ligne 85 : | ||
====Implementation==== | ====Implementation==== | ||
The configuration files will be stored in the main server (where the user will upload through a website). This server was configured to function as a SFTP server so that the files could be retrieved automatically through script. | The configuration files will be stored in the main server (where the user will upload through a website). This server was configured to function as a SFTP server so that the files could be retrieved automatically through script. | ||
| − | |||
| − | |||
| − | |||
| − | |||
| − | |||
| − | |||
| − | |||
| − | |||
| − | |||
Then, I created a bash script (implemented in Raspberry Pi) where it will make a query to the MySQL database to retrieve the file name and the it will connect to the SFTP server and download the given | Then, I created a bash script (implemented in Raspberry Pi) where it will make a query to the MySQL database to retrieve the file name and the it will connect to the SFTP server and download the given | ||
configuration file. | configuration file. | ||
| − | [[Fichier:Arch partial P10.PNG|frame|Partial architecture of the system | + | [[Fichier:Arch partial P10.PNG|frame| center |Partial architecture of the system]] |
| + | But, after having a discussion with the prof, we decided that the main server itself will configure the boards in each Raspberry Pi. So, I had to modify the initial code, by implementing a bash script where the hex file will be copied to the RPi via SCP and then it'll be configured according to the information retrieved from the database (such as the daughter board to be configured). The result of the configuration will be stored in a log file in the main server. | ||
===Collecting log and sensor data=== | ===Collecting log and sensor data=== | ||
| + | ====Objective==== | ||
| + | *Sensor data: To be able to retrieve data from the daughter boards and send them to the server so that they are stored for later use(graph display, etc.). | ||
| + | *Log data: To notify the admin whether the configuration of the boards are carried out with success or not. | ||
| + | ====Implementation==== | ||
| + | =====Log data===== | ||
| + | The log data are collected at the same time the boards are configured. [http://193.48.57.161/log Log page] | ||
| + | =====Sensor data===== | ||
| + | Raspberry Pi will collect the data from the daughter boards using the USB link (and if there’s any problem with the USB link,the data will be collected through serial interface). The data collected would be in the form of : | ||
| + | |||
| + | <table border="2" align=center> | ||
| + | <tr> | ||
| + | <td width="250" align=center>Transmission mode<br> ( S : USART, U : USB, R : Radio)</td> | ||
| + | <td width="100" align=center>Raspberry Pi ID</td> | ||
| + | <td width="100" align=center>Daughter board ID</td> | ||
| + | <td width="100" align=center>D2B ID</td> | ||
| + | <td width="100" align=center>Data</td> | ||
| + | </tr> | ||
| + | </table> | ||
| + | <br> | ||
| + | |||
| + | Later, these data will be sent over the network to the server through UDP communication where the Raspberry Pi acts as UDP client and the server listens to the port 4848 (in a multithreaded program) so that a thread is launched every time a new UDP datagram arrives at the server. | ||
===Creating a website to display sensor data=== | ===Creating a website to display sensor data=== | ||
| + | ====Objective==== | ||
| + | To display the values stored in a TSV file in the form of graph (for a given period, i.e.: a week) and also to display instantaneous values (current, minimum and maximum). | ||
| + | ====Implementation==== | ||
| + | =====Graph===== | ||
| + | Use of d3 javascript [https://d3js.org/ D3 JS]to read the TSV file line by line and display in the form of graph for each board. | ||
| + | [[Fichier:Graph.PNG |thumb |600px | center | Temperature graph created with D3 JS ]] | ||
| + | |||
| + | =====Instantaneous values===== | ||
| + | Use of [http://www.3quarks.com/en/SegmentDisplay/ 3 Quarks] 14-segment display to visualize instantaneous values. | ||
| + | [[Fichier:inst.png |thumb |500px | center | Instant temperature value ]] | ||
| + | |||
| + | ==Source code== | ||
| + | Zip file : [[Fichier:P10-Lilliad-Source-code.zip]] <br/> | ||
| + | GitHub [https://github.com/MageshwaranSekar/LILLIAD link] | ||
Version actuelle datée du 24 mars 2016 à 15:22
Sommaire
The library of University of Lille 1 is in the transformation phase to becoming LILLIAD Learning Center Innovation by 2016. Based on strong service proposal, LILLIAD will offer a unique combination of discovery and experimentation of innovation through an event complex, an experimentarium, educational space and documentary collection. LILLIAD, as desired by University of Lille 1 and the region of Nord-Pas de Calais, will be a place to think, learn and discover about innovation. Situated in the heart of the campus, it will be accessible to companies, innovators, educational institutes and public.
Scope statement
Project overview
Context
To enrich the user experience, the new library will be equipped with multiple sensors (for temperature, etc.) in large scale. However, it requires a lot of effort to implement and configure these sensors. Hence, we had to come with a solution that could automate the reconfiguration process.
Objective
The main goal of this project is to develop a user interface which allows the personnel of LILLIAD to use and maintain the deployed network of sensors. This interface should allow them to configure the sensors by uploading the required files to the main server. On the other hand, we will also be developing a reliable data communication between the sensor boards and the server through radio communication and wired communication in case of wireless network failure. A web interface will also be developed so that the users (students, guests) of LILLIAD would be able to visualize the different data (temperature, luminosity, etc.) to determine their preferred spot in the LILLIAD building.
Project description
LILLIAD is a modern building that will be equipped with huge network of sensors. These sensors will be used to capture and collect data (such as temperature, luminosity, AQI, etc.) to inform the users and personnel of LILLIAD. The sensors will be connected with a Raspberrry Pi in a star topology and the latter will be connected to the local area network (LAN). The Raspberry Pi could be used not only to send data (especially logs) to the central system but also to reconfigure the sensors.
Project phases
- Reservation of time slot to roll-out configuration:
- Develop a database to store information about configuration files and the boards (MB, DB, D²B)
- Integrate a web interface for an admin to upload configuration files
- Deploying configuration via network:
- Automatize the configuration of the boards via scripts
- Update the state of configuration (success or failure) and notify the admin
- Collecting log and sensor data:
- Collect log data received through serial communication for debugging
- Collect raw data from the sensors (through wireless or wired communication in case of failure)
- Process the raw data and store it in the server
- Creating a website to display sensor data:
- Visualize the processed data in a graph for different type of data (luminosity, noise, etc.) via website
Planning
11 – 16 Jan:
- Change the automatic configuration of boards from method 1 to method 2
Method 1: Each Raspberry Pi will query the database server and retrieve the configuration file
Method 2: Instead of Raspberry Pi, the main server, itself will send the configuration file to the Raspberry Pi
18 – 29 Jan:
- Collect raw sensor data (received through wireless communication)
- Identify each data (board ID, type of data and values from sensors)
- Store the processed data in a form of CSV (or TSV) file
1 – 5 Feb:
- Create a HTML5 website to display different types of data from the CSV (or TSV) files created earlier
8 – 20 Feb:
- Collect log data of the boards using Raspberry Pi
- Export the log data (periodically) to the server
22- 24 Feb:
- Prepare for project demo and presentation
Work progress
Reservation of time slot to roll-out configuration
Objective
To enable an administrator to reserve a time slot through a web interface (where the configuration file will be uploaded) so that the boards (daughterboard, d2b) connected to the network are configured according to the schedule.
Conception
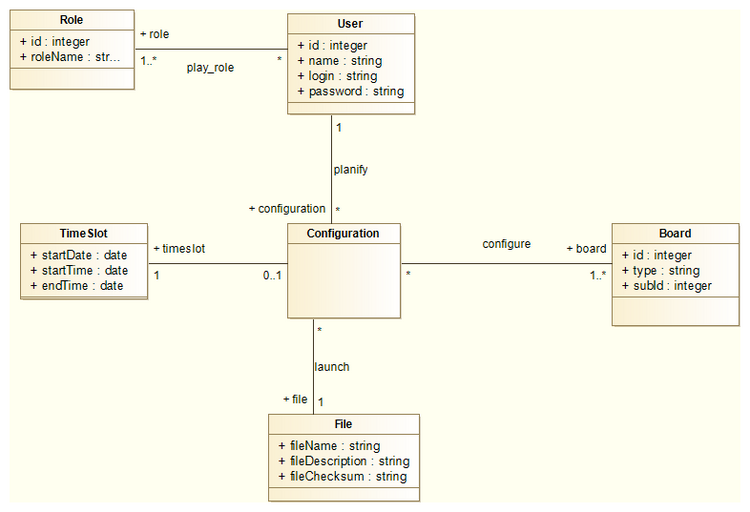
To manage the time slots, it’s important to have a database. Thus, I had to come up with a block diagram (of a databse) that describes relationships between each block.
To normalize the diagram, I had to identify the primary and foreign key and use intermediate table such as “configure” and “play_role” as described below:
Role(id[PK],roleName) User(id[PK],name,login,password) Play_role(roleId[FK->Role],userId[FK->User],PK[roleID,userId]) TimeSlot(startDate,startTime,endTime,PK(startDate,startTime)) Board(id,type,subId,PK(id,subId)) File(fileName[PK],fileDescription,fileChecksum) Configuration(startDate, startTime, idUser[FK->User],fileName[FK->File],[FK(startDate, startTime)->TimeSlot],PK(startDate, startTime)) Configure(startDate, startTime,id ,subId, [FK(startDate, startTime)->Configuration], [FK(id, subId)->Board],PK(startDate,startTime, id, subId)) |
Implementation
To implement the database, I started with the installation of LAMP stack in Linux. Thus, the packages “apache2, php5, mysql-server php5-mysql” were installed. Then, it was time I configured the MySQL database with the relational database model conceptualized earlier.
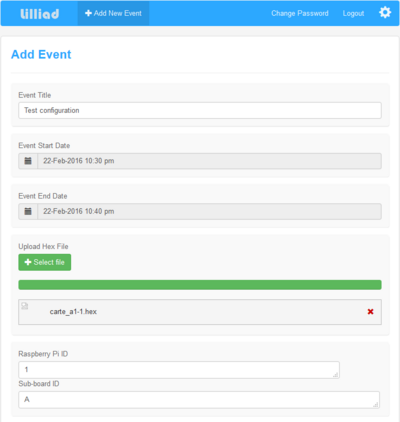
And then, I implemented a website (as shown in figure below) where an admin would be able to upload hexadecimal configuration files and determine the timeslot of the configuration for the boards. The configuration timeslot is limited to 10pm to 6am the following day.
Deploying configuration via network
Conception
To be able to configure equipment automatically via network, we need to have a file server where all the configuration files will be stored. Each equipment must retrieve those files and configure the boards (and the sensors) automatically.
Implementation
The configuration files will be stored in the main server (where the user will upload through a website). This server was configured to function as a SFTP server so that the files could be retrieved automatically through script.
Then, I created a bash script (implemented in Raspberry Pi) where it will make a query to the MySQL database to retrieve the file name and the it will connect to the SFTP server and download the given configuration file.
But, after having a discussion with the prof, we decided that the main server itself will configure the boards in each Raspberry Pi. So, I had to modify the initial code, by implementing a bash script where the hex file will be copied to the RPi via SCP and then it'll be configured according to the information retrieved from the database (such as the daughter board to be configured). The result of the configuration will be stored in a log file in the main server.
Collecting log and sensor data
Objective
- Sensor data: To be able to retrieve data from the daughter boards and send them to the server so that they are stored for later use(graph display, etc.).
- Log data: To notify the admin whether the configuration of the boards are carried out with success or not.
Implementation
Log data
The log data are collected at the same time the boards are configured. Log page
Sensor data
Raspberry Pi will collect the data from the daughter boards using the USB link (and if there’s any problem with the USB link,the data will be collected through serial interface). The data collected would be in the form of :
| Transmission mode ( S : USART, U : USB, R : Radio) |
Raspberry Pi ID | Daughter board ID | D2B ID | Data |
Later, these data will be sent over the network to the server through UDP communication where the Raspberry Pi acts as UDP client and the server listens to the port 4848 (in a multithreaded program) so that a thread is launched every time a new UDP datagram arrives at the server.
Creating a website to display sensor data
Objective
To display the values stored in a TSV file in the form of graph (for a given period, i.e.: a week) and also to display instantaneous values (current, minimum and maximum).
Implementation
Graph
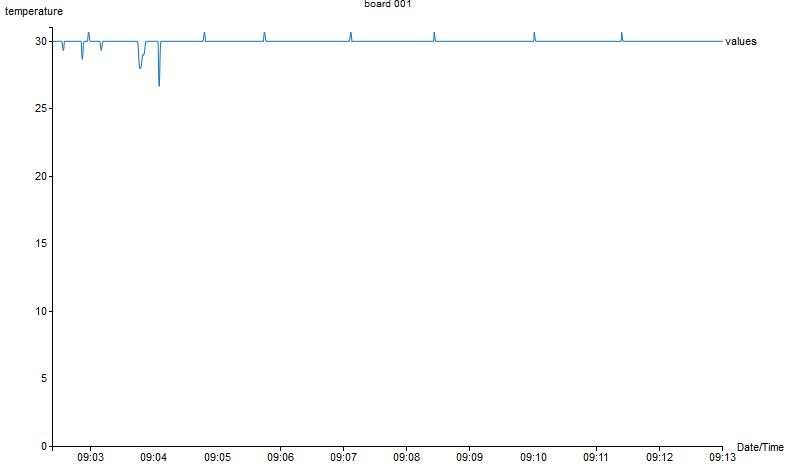
Use of d3 javascript D3 JSto read the TSV file line by line and display in the form of graph for each board.
Instantaneous values
Use of 3 Quarks 14-segment display to visualize instantaneous values.
Source code
Zip file : Fichier:P10-Lilliad-Source-code.zip
GitHub link


